QGIS Layer Viewer is a lightweight, serverless web map viewer that reads QGIS Layer Definition files (.qlr) and GeoJSON data directly in the browser, rendering them on an OpenLayers map with styling that closely matches the original QGIS project — including categorized and graduated symbology, dash patterns, glow effects, SVG markers, labels, and map tips.
No backend, no server-side processing, no upload to any cloud service. Files are read locally or fetched from a URL. Everything runs in the browser. Deploy by copying two files to any static web server.
Who is it for? GIS professionals who work in QGIS and need to share styled maps on the web without rebuilding symbology from scratch.
What problem does it solve? The gap between a styled QGIS layer and a publishable web map. Export the .qlr, pair it with a GeoJSON, drop both into the viewer — done.
What is it not? A full GIS editor. It does not support raster layers or WMS. It is a read-only preview and sharing tool.
UI Explained
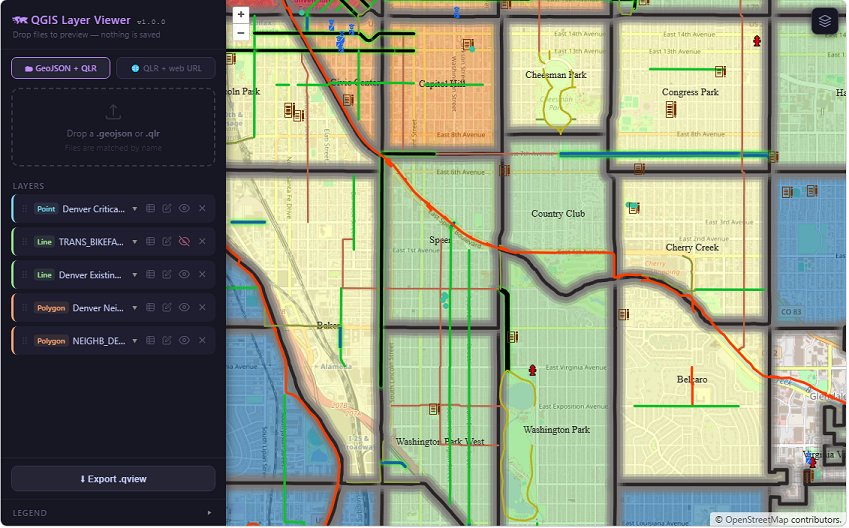
A resizable panel on the left contains all controls. The panel is resizable by dragging its right border (220–520px). The map fills the remaining viewport.
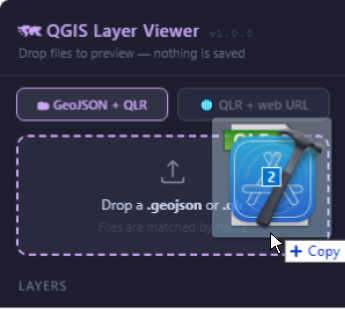
Drag and Drop Interface
Drag and drop files means letting users adding layers files from their operating system (e.g., Windows Explorer, macOS Finder) directly into the application. The controls are located at the top of the left panel.
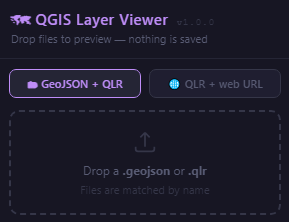
There are three (3) options to add layers.
- GeoJSON plus an QGIS Layer Definition File (QLR)
- An QLR files that references internally a data source
- An QGIS Layer Viewer export file format .qview.
Any number of layers can be loaded in sequence.
Geojson plus QLR
GeoJSON + QLR is the default option.
GeoJSON is a geospatial data interchange format based on JavaScript Object Notation (JSON). It defines several types of JSON objects and the manner in which they are combined to represent data about geographic features, their properties, and their spatial extents.
Although the Internet Engineering Task Force (IETF) published RFC 7946 in 2016 that established a strict rule-intended to simplify interoperability across the web- that GeoJSON must use WGS 84 longitude–latitude coordinates, the reality is that modern GIS softwares are more flexible. Tools like QGIS allow users to export GeoJSON in any coordinate reference system.
GeoJSON does not support styles of any kind. The format contains only geometry and attributes. Styling—colors, line widths, fill patterns, labels, symbols—must always be handled externally by the software that renders the data. In QGIS Layer Viewer, the style is provided by accompanying the Geojson with a QGIS Layer Definition File or QLR file.
A .qrl file in QGIS is a QGIS Layer Definition File. It stores the symbology (colors, line styles, etc.), labels (text formatting, placement, rendering settings (transparency, blending modes, etc.), and other layer properties for a layers in a project, but not the actual data itself. The QLR file only references the data source. The section Symbology parsed from the QLR below ha a brief narrative about how QGIS Layer Viewer handles the imported symbology.
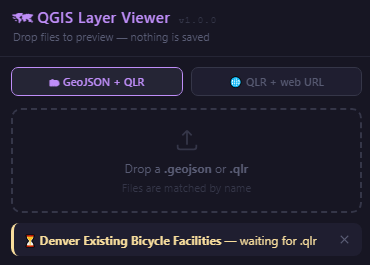
Drop a .geojson and its matching .qlr in any order and the app matches them by filename stem. Either file can come first, a pending indicator shows which file is waiting for its partner, with a cancel (X) button. Full filename shown in a tooltip (title attribute) when truncated. Drop both files simultaneously and the pairing logic resolves them instantly.
QLR with Data Source URL
In the case where the QLR file references the URL of the data source, the QLR + web URL option allows to drop only the .QLR file. The viewer reads and fetches GeoJSON automatically. Supports ArcGIS FeatureServer with OID-keyset pagination and SQL filter rewriting.
- ArcGIS FeatureServer with OID-keyset pagination and SQL filter rewriting.
- An URL of a GeoJSON file in a remote server loaded to QGIS using Data Source Manager.
Import file format .qview.
A .qview file is a self-contained portable map created by QGIS Layer Viewer. It bundles everything needed to reproduce a map session into a single JSON file — the raw QLR styling, the complete feature data, and all user-edited settings — so the recipient can open it by dropping it into any instance of the viewer with no additional files, no GIS software, and no internet connection required. Read about exporting a .qview file below.
Layer control
Below the Drag and Drop section is the Layers control, the central place to manage all layers in the project — controlling their visibility, order, grouping, and styling.
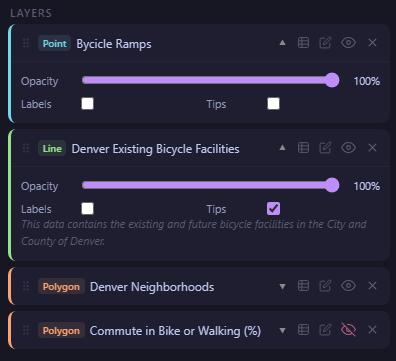
Each layer is displayed with a color-coded border according to its geometry type — cyan for points, green for lines, orange for polygons — and offers individual controls: a visibility toggle, a remove button with confirmation, and an expandable row with more detailed settings.
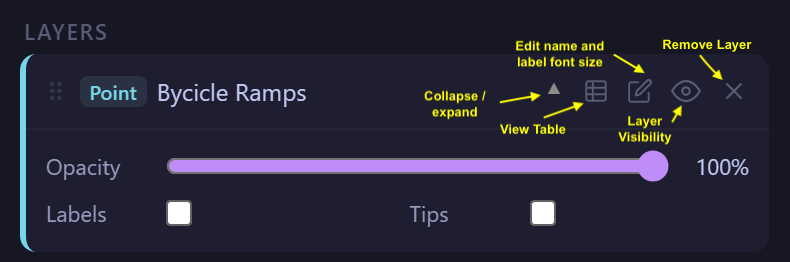
- A Table icon opens the attribute table viewer for that layer.
- Pencil icon (✏) opens the Edit Layer modal.
- The Visibility toggle (eye icon) per layer; turns red when hidden.
- Remove layer with confirmation dialog.
- Collaps row: opacity slider (live), Labels toggle, Tips toggle, and abstract text.
Expanding a layer reveals the opacity slider (with real-time effect), the labels toggle, the map tips toggle, and, when available, the layer’s description text taken directly from the .qlr file.
There is no limit to the number of layers that can be loaded. The viewer automatically stacks them in a logical order: polygons at the bottom, lines in the middle, and points on top. This order can be changed at any time by dragging layers within the side panel, and the map updates immediately. Each time a new layer is added, the map automatically adjusts the view to show the full extent of all loaded layers.
Labels
Labels are read from the <labeling type="simple"> block in the .qlr file. They must be configured and enabled in QGIS before exporting. The viewer supports font family, weight, color, size (with unit conversion), and text buffer (halo).
Labeling support
Properties parsed from the QLR
<text-style> fieldName
Feature attribute used as the label text.
<text-style> fontSize + fontSizeUnit
Font size with unit — converted to CSS pixels at load time.
<text-style> fontFamily, fontBold, fontItalic
Font family, weight, and style.
<text-style> textColor
Label fill color in QGIS RGBA format.
<text-buffer> bufferDraw
Whether to draw a halo around the label text.
<text-buffer> bufferSize + bufferColor
Halo width in MM and halo color.
Label placement by geometry
Points
placement: pointLabel centered on the feature coordinate.
Lines
placement: lineLabel follows the line orientation automatically.
Polygons
placement: pointLabel placed at the visual centroid.
Font size unit conversion
PointPixelMMInchMetersAtScale / MapUnitAttribute table
Clicking the table icon on any layer opens a bottom drawer that occupies roughly one third of the screen, keeping the map visible above.
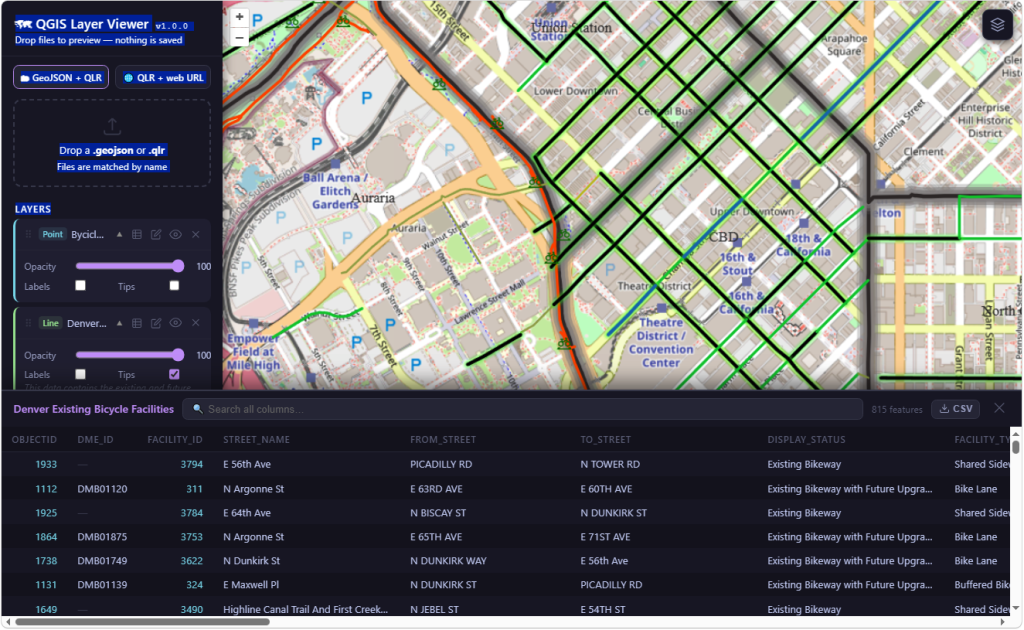
Columns can be sorted ascending or descending by clicking their header, and the search box filters all columns simultaneously, showing in real time how many records match. Clicking any row centers the map on that feature and briefly highlights it with a double cyan stroke. The current view — with any active filters and sort order applied — can be exported directly as a CSV file.
Map tips
Hovering over a map feature can display a popup configured directly from the .qlr file. It corresponds to the value or expression set in the Display Name setting in QGIS (Layers properties > Display) when exporting the .qlr file.
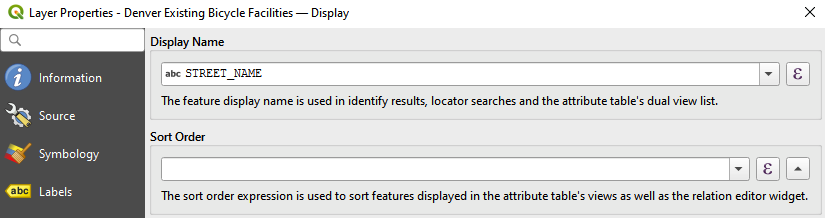
The viewer supports both simple attribute field references via QGIS’s preview expression, and full HTML templates with field value substitution. The tooltip automatically repositions itself to stay within the screen boundaries. This feature is toggled individually per layer from the side panel and is off by default.
Basemap Switcher
A Floating layers-stack button (top-right of map) allows to select among six (6) background maps. It opens a 3×2 grid of live tile previews.
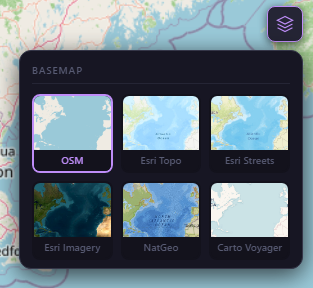
Six basemaps are availables: OSM, Esri Topo, Esri Streets, Esri Imagery + reference labels overlay, NatGeo, Carto Voyager. The Active basemap is highlighted with purple border.
Closes on outside click.
Export QGIS Layer Viewer map bundle
The ↓ Export .qview button bundles all layers (QLR + GeoJSON + edited state) into a single portable JSON file with extension .qview .
A .qview file is a self-contained portable map created by QGIS Layer Viewer. It bundles everything needed to reproduce a map session into a single JSON file — the raw QLR styling, the complete feature data, and all user-edited settings — so the recipient can open it by dropping it into any instance of the viewer with no additional files, no GIS software, and no internet connection required.
- What each layer entry contains
- Raw QLR XML — full QGIS symbology
- Complete GeoJSON feature snapshot
- Edited layer name and font size
- Stack order, opacity, visibility
- Key advantage — ArcGIS live service snapshot
When a layer is loaded from an ArcGIS FeatureServer — even one that required paginating thousands of records — the complete merged dataset is embedded in the .qview at export time. The recipient gets a point-in-time snapshot of the live service with no ArcGIS account or network access needed.
Legend
The Legend is displayed in a collapsible section at the bottom of the sidebar (collapsed by default). Only Layers that are visible are shown.
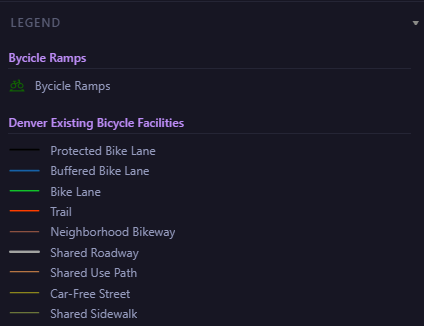
It updates automatically when layers are added, removed, or toggled. SVG swatches are generated inline from parsed symbol properties — no image hosting required.
Symbology parsed from the QLR
When a .qlr file is dropped into the viewer, its XML is parsed and the symbology is translated into native OpenLayers styles — no manual reconfiguration needed. The viewer reads three renderer types (singleSymbol, categorizedSymbol, graduatedSymbol) and handles multi-layer symbols, where several sub-layers are stacked inside a single QGIS symbol to produce effects like cased roads or outlined fills.
Symbology by geometry type
Supported symbol classes
SimpleMarker — 11 shapes including circle, square, star, cross, diamond
SvgMarker — base64-embedded or server-hosted, with param() color substitution
SimpleLine — solid, dot, dash, dash dot, dash dot dot
Custom dash patterns
Outer glow (symbol-layer effectStack)
SimpleFill — fill + outline
SimpleLine — outline-only mode
Outer glow (renderer-level effectStack)
Layer-level properties parsed
Read directly from the QLR file
Layer opacity
From <layerOpacity>. Applied to the map layer and editable via the opacity slider.
Layer name
From <layername>. Shown in the layer panel and legend. Editable via the Edit modal.
Abstract
From <abstract>. Displayed in the expandable layer row when present.
How glow effects are simulated
OpenLayers has no native glow primitive, so outer glow is approximated by stacking five strokes of increasing width and decreasing opacity beneath the main symbol stroke. The spread, blur, and color are all read directly from the QLR’s effectStack. For lines the glow sits on the symbol layer; for polygons it is stored one level up on the renderer itself — both cases are handled.
Future additions
The following – among others – are some addictions contemplated for the future.
- Advanced labels: rule-based labeling, QGIS expression evaluation, label collision avoidance.
- Additional symbology: MarkerLine, LinePatternFill, PointPatternFill, FontMarker.
- WFS and other OGC service sources in the QLR datasource.
- Print / export the map as an image or PDF.